How Much Do California’s County Workers Make?
In April, with the pandemic shutdown sending California’s economy into free fall, Gavin Newsom convened a Zoom meeting with the four living California ex governors. He asked them to describe the biggest crisis they faced while in office. As reported by the New York Times, according to Pete Wilson, it was the 1994 Northridge earthquake. For Gray Davis, it was the electricity brownouts that cost him his job. Arnold Schwarzenegger and Jerry Brown both cited the Great Recession as their biggest challenge. None of them considered what they faced to be comparable to what Newsom is up against.
In June, as the lockdown eased, California’s economy started to come back to life. Maybe the damage would be contained, and maybe recovery would be swift. But when the COVID case count ticked upward in late June and early July, Newsom tightened the screws. He called his new approach using a “dimmer switch,” which would turn up or down depending on rates of positive cases and hospitalizations.
Whatever it’s called, the consequence of Newsom’s dimmer switch is less economic activity. In February 2020, California’s unemployment rate was at a historic low of 3.9 percent. Three months later, in May, it was at a historic high of 16.4 percent. As the lockdown eased, it ticked down a bit, tracking at 14.9 percent in June. With the new lockdown measures, it could go back up. One thing is certain: The pandemic shutdown is not going to end soon, as was hoped for only a month ago. California’s economy, along with the rest of the nation, is in for a long, hard slog.
The impact of an economic slump directly affects California’s state and local governments through lower tax revenues. These impacts are well documented. A projected $54 billion state budget deficit. Some California cities are seeing their tax revenue cut by over 50 percent, with no end in sight. California’s counties are equally stressed; Los Angeles County projects at least a $2 billion shortfall over the next twelve months. For an excellent and comprehensive guide to the sources of tax revenue in California, read “California’s Tax System,” from the Legislative Analyst’s office. For a summary of its contents, “Fiscal Impacts of COVID-19 and California’s Economy” from UC Berkeley is as good as any.
Rather than offer further recap of California’s imploding tax revenues, or describe the services that could be cut as a result, this series of reports focuses on the supposed third rail of California government expenditures: employee pay and benefits. Thanks to the power of public sector unions, and the politicians they control, public employee pay and benefits in California are politically untouchable. Reductions in their rate of increase, framed by union compliant politicians and press as concessions, apparently are all that political realists can hope for. But times have changed.
Last week, in part one, rates of public sector pay and benefits in California’s cities were summarized, using 2019 data that was recently posted by the State Controller’s Office. The results speak for themselves. No matter what you consider, the entire state, or individual localities, full-time non-safety workers employed by California cities earn pay and benefits that are invariably about twice what individual private sector workers earn.
For example, statewide, the average non-safety city worker earned pay and benefits of $130K in 2019, compared to $74K for the average private sector worker. For reasons described in part one, conservative assumptions were used in both cases, meaning the estimates likely understated the average value of public sector compensation, and overstated the actual average private sector compensation.
How Much Do California’s County Workers Make in Pay and Benefits?
This report calculates public sector compensation for California’s counties. It employs the same assumptions as the earlier report on compensation for California’s cities, and uses the same format. The first chart shows, by department, the compensation trends in counties between 2015 and 2019. At first glance, the increases in total compensation are fairly modest, considering four years have elapsed. Overall firefighter and miscellaneous employee compensation is only up 7 percent, and sheriff compensation is actually down 4 percent. But appearances can be deceiving.
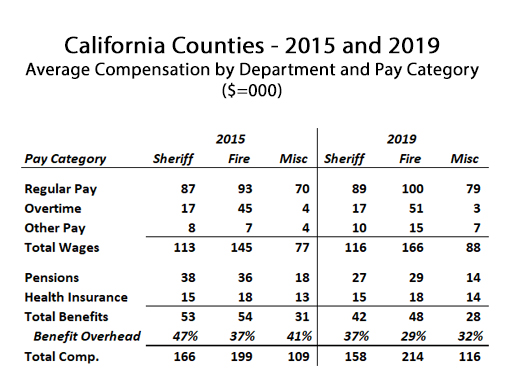
As discussed in great detail in part one (so we won’t do it again here), starting in 2017, employers are not required to report (ref. page 10, Step B13) the contribution towards the unfunded liability as part of an employee’s pension benefit. If you just substitute 2015 pension contributions into the 2019 variables, total compensation for sheriffs in 2019 rises 2 percent to $169K, firefighter compensation rises 11% to $220K, and miscellaneous employee compensation rises by 11% to $120K.
This method still yields estimates that are misleadingly low, because pension contributions did not stay the same between 2015 and 2019. In fact, in most of California’s state and local public employee pension systems, in order to comply with new GASB regulations that have made it harder to employ creative financing gimmicks, required pension contributions are going to double over the next few years. And that was before the pandemic slowdown negatively impacted pension systems earnings.
What California Counties Pay the Most to Their Public Servants?
When comparing public sector pay to private sector pay, it is usually difficult to come up with apples-to-apples analysis. Many public sector jobs do not have easily comparable counterparts in the private sector. And in many cases when those comparisons are made, the expectations of the job may be significantly different and the various forms of compensation offered by the job may be difficult to quantify.
These challenges, which may provide ample content for a future analysis, limit the scope of what conclusions can be drawn from the following data. But as noted, the assumptions made to estimate private sector pay are, if anything, overstating the averages. The reasons for this are discussed at length in part one in the section “How Does Public Pay Compare to Private Pay in California?”
In the tables to follow, for example, average total compensation for county employees is compared to median household income for those counties. In the far right column on each table, “TC/MHI,” the ratio of total compensation over median household income for that county is presented. It must be emphasized that any more comprehensive analysis would cause these ratios to increase. To summarize the reasons why:
Public employee compensation is understated because pension contributions are understated, prefunding of retirement health benefits are not included, and the value of more public sector paid days off is not taken into account. Median household income, on the other hand, takes into account multiple wage earners in most households. And, just to be clear about this: In the public sector – very much unlike in the private sector – median compensation never differs significantly from average, and often the median is actually higher than the average.
Taking this all into account, the next chart shows the top ten counties in California in terms of average total compensation for non-safety employees. Some of these averages are surprisingly high. The average full-time non-safety employee in San Mateo County made over $160K in pay and benefits in 2019. And while San Mateo County is among the wealthiest counties in California, with a median household income of $114K, as shown, the average non-safety county worker still made 1.4 times more than what these high income households managed to earn.
Perhaps more noteworthy, and something also reflected on the tables that report on public safety compensation in California’s counties, are the TC/MHI ratios in areas with relatively low household income. For example, the average county employee makes more than twice the household income of Riverside County, where the household income averages $64K, and also in San Joaquin County, where the household income averages $61K.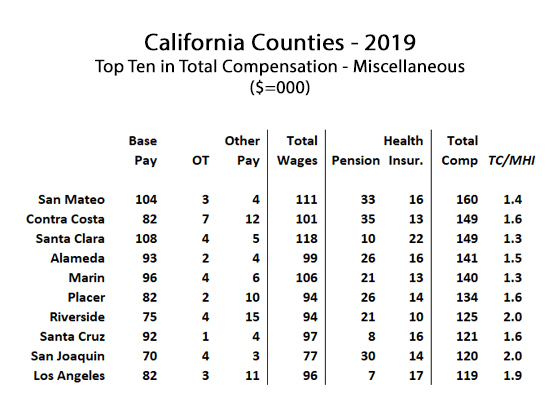 The top ten counties for sheriff compensation are displayed on the next chart, with wealthy San Mateo County again taking the top spot. With California’s beleaguered police and sheriffs coping with the pandemic, social unrest, and political attacks on their ability to do their job, it is not necessary to belabor their compensation issues. Especially since police and sheriff compensation in California is consistently and significantly lower than firefighter compensation, in spite of their jobs delivering more stress, harder work, and equivalent levels of on-the-job injuries and fatalities.
What should be observed, however, is the fact that overall, police and firefighter compensation is at levels that leave very little flexibility to cope with current and future challenges to public safety. Out-of-control pension costs – for whatever reason – not only are themselves an unsustainable drain on civic budgets, but lead to equally out-of-control overtime costs because paying overtime is preferable to hiring another full-time employee with pension benefits.
As will be explained, the next chart helps to show not only the centrality of pensions as a fiscal crisis, but also the problem of even getting usable information as to their true costs. Looking at this chart, one might immediately wonder why is Santa Clara County able to pay their sheriffs on average $190K per year, whereas in San Mateo County it costs an astronomical $277K to employ a full-time sheriff? Why is Santa Clara County’s TC/MHI ratio only 1.6, when San Mateo County’s is 2.5? The answer is simple, but evidence of problems getting good data.
Observe the reported pension costs for Santa Clara County sheriffs of only $19K in 2019. Taxpayers should all be so lucky. When taking into account payments to reduce the unfunded liability, pension costs for public safety employees in California invariably average around 50 percent of base pay, sometimes much higher. San Mateo County’s average pension cost of $82K per full-time firefighter is much more representative of what it truly costs to fund these pensions. The disparity in pension costs between San Mateo and Santa Clara counties is mostly an illusion, caused by different accounting treatments.
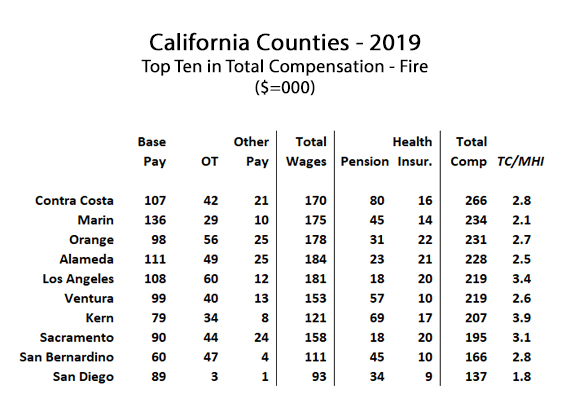
The California State Controller needs to issue clear guidelines to local agencies regarding how to fairly allocate these unfunded liability payments to active employees and retirees, because these costs are real, and are killing civic budgets up and down the state. Until then, compensation analysts may expect barely usable, consistently inconsistent gobbledygook for what is indisputably the biggest variable affecting public sector compensation.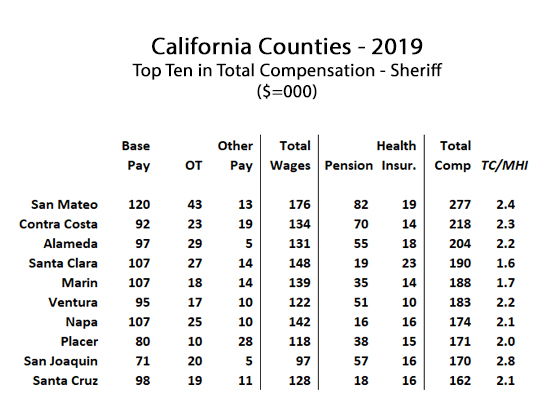 The final table shows California’s top ten counties for firefighter compensation. Notably absent is San Mateo County, and the reason for that bears further explanation. Unlike sheriffs, for which every county has a department, many fire agencies exist as special districts that are either fully independent or partially independent of county administration. In California, in addition to city fire departments and county fire agencies, there are 102 fire protection districts or fire authorities.
Some of these fire protection districts only have one or two full-time employees, and rely heavily on volunteers. Excluding the top two, the average full-time headcount for these fire agencies is 29, and the median headcount is 8. The top two of these independent fire agencies are included in this analysis, however, because they are quite large. They are the Orange County Fire Authority and the Sacramento Fire Protection District. Their compensation records, which unfortunately are still only available for 2018, was merged into the county data table to complete this analysis as representing Orange and Sacramento counties, respectively, and both appear in the top ten.
Taking all that into account, the leader in firefighter compensation is Contra Costa County, at $266K in pay and benefits per year for the average full-time firefighter. This means that in 2019 the average full-time firefighter in Contra Costa County made nearly three times what the average household income was in that county in that year.
Missing from the top ten is San Mateo County, and the reason why can explain why other wealthy counties, Santa Clara in particular, are missing from the top ten. These counties that ought to appear in the top ten do not because they don’t have a county fire agency, nor do they have a significant special fire protection district serving them. Instead, the bulk of fire services in these counties are provided by city fire departments. In San Mateo County, for example, Redwood City’s full-time firefighters earned $276K in pay and benefits in 2019. Other cities in San Mateo County were not independently analyzed, because only the 100 largest city fire departments (in terms of headcount) were considered.
As for within Santa Clara County, city fire departments represented three of the top ten, Santa Clara at $279K (TC/MHI a whopping 3.7), Palo Alto at $249K, and Mountain View at $215K. The data on fire department compensation in California justifies a more in-depth analysis that merges the full-time compensation records from the State Controller for fire personnel in all three data sets – city, county, and special district – to come up with useful and accurate composite information on just how much they make.
The intended message underlying the presentation of all this compensation data is that California’s local governments cannot hope to weather the economic storms that have just begun unless they cut pay and benefits, along with cutting headcount and cutting services. While making less is never palatable, it may be more digestible than coping with inadequate human resources to cope with challenges to the public, whether they’re fires, unrest, or social hardship.
As noted in part one, one city in Orange County, Placentia, was able to put their fire department onto a financially sustainable path by breaking free of the Orange County Fire Authority. Instead they formed an independent fire department, where they dramatically reduced operating costs through the use of trained volunteers, hiring part-time firefighters to reduce overtime costs, contracting with a private ambulance service, and replacing pensions with a 401B defined contribution plan. The performance of this innovative fire department going forward should be closely watched.
There are analogues to what Placentia did with fire protection services across all public sector disciplines. Where are job descriptions too narrowly defined? Where do opportunities to contract with private sector services make operational and financial sense? What services and functions can be eliminated, such as the ridiculously bloated administrative overhead in public schools?
Asking these questions is unpleasant. Implementing them is hard. But California’s public agencies need to think creatively, and make some hard choices, because now more than ever, it is in the public interest. As for Newsom, for reasons that will only be judged by history as necessary or not, he has imposed a dimmer switch on California’s private sector. This “dimmer switch” is wiping out generational wealth, disproportionately destroying small family businesses, obliterating incomes, and forcing those lucky enough to still have a job to accept harder work with less pay. In these times, the public sector worker must step up to share the burden, so long as they still wish to be known as public servants, not public overlords.
This article originally appeared on the website California Globe.
* * *

Edward Ring is a contributing editor and senior fellow with the California Policy Center, which he co-founded in 2013 and served as its first president. He is also a senior fellow with the Center for American Greatness, and a regular contributor to the California Globe. His work has appeared in the Los Angeles Times, the Wall Street Journal, the Economist, Forbes, and other media outlets.
To help support more content and policy analysis like this, please click here.