Government Worker Understates Average Pension

Today’s Sacramento Bee featured a viewpoint column entitled “Pension ‘Reformers’ distort facts on benefits.” The column was written by Martha Penry, “a special education teacher’s assistant in the Twin Rivers school district.” Not disclosed in the article was the fact that Ms. Penry is also a high ranking public employee union official, as evidenced by her membership on the CSEA Board of Directors.

In her column Ms. Penry accuses “pension busters” of overstating the cost of pensions and the amount of the average pension. She claims that “three quarters of CalPERS retirees collect yearly pensions of $36,000 or less.” What Ms. Penry does not do, however, is acknowledge that the average she is referring to includes retirees who didn’t work full time, or who didn’t work much more than five years (the minimum vesting period for a pension), or who retired decades ago when pay rates and pension formulas were still fairly reasonable.

A more honest assessment of the average pension has to examine rates for people who are retiring now, under today’s pay scales and pension formulas, who have worked their full careers in government service. Here is the most recent information, drawn directly from the annual reports of Cal STRS and CalPERS:

From the CalSTRS Annual Report, page 135:
CalSTRS participants who retired during the 12 months ending June 30th, 2010 (the most recent data), earned pensions as follows:
25-30 years service, average pension $50,772 per year.
30-35 years service, average pension $67,980 per year.
35-40 years service, average pension $86,736 per year.

From the CalPERS Annual Report, page 151:
CalPERS participants who retired during the 12 months ending December 31st, 2009 (the most recent data), earned pensions as follows:
25-30 years service, average pension $53,182 per year.
30+ years service, average pension $66,828 per year.

When one considers that the highest Social Security benefit possible, for people earning over $125,000 per year, is only $31,000, starting at age 68, it boggles the mind that anyone can suggest that reducing pension formulas for California’s state workers will risk “forcing retirees into poverty.” When government workers spend an entire career in government service, they earn pensions that are literally triple (or more) what they might have expected to receive from social security.

A related point Ms. Penry makes regards not the scale of the pensions, but the amount paid into pensions. She writes “public employee pensions amount to just 3% of California’s budget.” This is also grossly misleading. To dive into the numbers and better understand why that number is far, far too low, refer to “How Rates of Return Affect Required Pension Contributions,” “Why Real Rates of Return Must Fall,” and  “California’s State AND Local Personnel Costs

An equally relevant (and faster) way to sanity check Ms. Penry’s “3%” figure, however, is to consider not what California’s taxpayers are paying today into Wall Street pension funds for their government workers, but what taxpayers will pay in the future if reforms aren’t made. There are 1.85 million state and local government employees in California. As they retire they are replacing people who retired when pay scales and pension formulas were far more sustainable. Using an average career of 30 years and an average retirement of 20 years, we are on track to have 1.25 million retired state and local workers collecting, on average, $60,000 per year in retirement pension payments. That equals $75 billion per year. Shall the taxpayers, who will collect an average social security benefit of $15,000 per year, really be called upon to make up a difference of that magnitude when Wall Street returns fail? Because that process has already begun.

Ms. Penry got one thing right in her column today – reducing pension benefits being paid to former, current and future government workers is not going to solve California’s budget woes all by itself. The base rates of pay for most government workers will also have to be reduced. It is ironic that the unions representing government workers seized the opportunity when the economy was enjoying the phony real estate boom (and the internet bubble before that) to negotiate dramatic increases to their compensation packages, yet are blind to the need to reduce those packages now that the bubbles are burst.

Anyone who believes that calls to lower pension benefits for government workers is just “pension busting,” is invited to review the data presented here and in related posts. By pretending the “average” pension includes part-time workers, workers who only logged a few years in government service, and people who retired long before pension benefits were inflated beyond sustainability, it is Ms. Penry who is distorting the facts.

The Extremists of the Status Quo

At a recent political event I encountered a libertarian group who were passing out a test designed to determine one’s political ideology. Their model had two continua represented as sides of a checkered board with 100 squares. This square board was rotated 45 degrees, with one continuum (2 opposite sides) containing the degrees between the extremes of statist (big government) vs. libertarian. The 2nd continuum on the board contained the degrees between the extremes of social liberal and social conservative. They were measuring the political opinions of attendees with a 20 question test, 10 questions designed to measure one’s statist vs. libertarian leanings, and 10 questions designed to measure one’s social liberal vs. social conservative leanings.

As an attempt to quantify voter psychographics into terms of political ideologies, this model is helpful and probably has a great deal of practical value to politicians and their campaign organizations. The choice of two ideological continuums, a moral value system, and a fiscal value system, is an astute recognition that common political labels, left and right, liberal and conservative, are multidimensional. But for political paradigms that model and map the collective political psychology of voters to properly reflect political reality – the structure of government and governance – another dimension is required.

This third continuum would measure the degrees between the extremes where vested interests collectively command and control the economy and society, and an extreme where there is a continuous and nurtured upwelling of aspiring, emergent interests. Put another way, those who favor the status-quo vs. those who favor a competitive, pluralistic system that embraces creative destruction and bestows upward mobility and material success based on merit.

When this continuum is applied, one might observe an identity of interests between anything big and entrenched, whether it is big government, big business, or big labor. Through the lens of this continuum, it is easier to recognize examples of policies that have worthy goals but also lead to the thwarting of upwardly mobile companies and individuals, despite the merit of their ideas and innovations. There aren’t many examples of how big government, big business or big labor – if they are aligned towards the status-quo extreme of mutual collusion – have been friendly towards competitive threats, whether they are emerging companies or disruptive innovations. Entrepreneurs with revolutionary, breakthrough technology to automate and improve and better our lives are disruptive to the wealth and power wherever it is; they are not always welcome.

Observing this third political continuum, representing a preference for dominance by status quo vested interests at one extreme, vs. embracing disruptive, upwardly mobile forces at the other, sends a multitude of valuable messages regarding how and where the force of democracy can be properly applied, and how enlightened electorates can be empowered. For example, embracing disruptive technologies and encouraging entrepreneurship often requires the dismantling of powerful bureaucracies across the spectra of vested interests – corporations, agencies, and unions. Such an embrace of competition and merit is color-blind and gender-blind, and gives the small players the chance to become big players; it nurtures economic pluralism in a free market. It embodies a version of capitalism that challenges conventional stereotypes.

Using the status-quo vs. upwardly mobile continuum can inform studies examining the reality of worker compensation between those who are lucky enough to work for the government, or belong to powerful private sector unions, and the rest of the workforce, who exist within the meritocracy of the globalized private sector. If you make these comparisons for workforces, the crowing by public employee union spokespersons about “executive compensation” is revealed as a canard, because the privileged members of public sector unions, ultimately, share a preference for the status quo with those wealthy elites. It is not tens of thousands of allegedly overpaid executives, but tens of millions of ordinary private sector workers, blue collar and white collar, non-union and often even those who are unionized, who occupy the other extreme on this new continuum, they are the upwardly mobile who compete in the global economy without special privileges.

If the voter demographics in the United States today could be quantified along the status-quo vs. upwardly mobile continuum – and if the consequences of a status-quo coalition controlling our political economy were adequately explained – it is likely a majority of the electorate would not prefer the status quo. But it is not social conservative vs social liberal criteria, or statist vs. libertarian criteria, that depicts this version of a society’s drift to an extreme. The commendable centrist middle squares within the two-dimensional political model described earlier do not recognize the extreme of status quo power, the reality of big government, big corporations, and big labor working in concert to perpetuate privilege and suppress competition.

Only by visualizing and aspiring to the centrist space within a cube that represents these three very distinct value continua can policymakers and policy advocates who aspire to a healthy democracy properly diagnose and cure the extreme of collusion between corporations, government, and unions, and place the other more conventional versions of left and right into their proper perspective.

The Fate of the Mourning Dove

A few months ago my wife and I noticed a pair of doves were building a nest in a nook above the front door of our home. Atop a piller, beneath an eve, inaccessible to any creature who couldn’t either fly or use a ladder, the location for this nest was thoughtfully chosen. Through the rainy days and nights of February, the birds completed their nest and sat on the eggs.

For nearly a month the birds were always there, until sometime in early March when they abandoned the nest. My wife checked the nest and verified the eggs were still there – apparently not destined to hatch, the Doves had left them to scavengers. Within a few weeks the eggs were gone, with the parents away another winged creature had broken them open and consumed them. But the doves weren’t through with us.

In April the birds returned, the female lay a new pair of eggs, and through the lengthening days they sat atop them. This time we were skeptical as to whether or not the eggs would hatch, but we were starting to get attached to this persistent, quiet pair. The neighborhood cats were also paying close attention.

On the morning of May 12th we left our homes to go to work and noticed the eggs had hatched. Within a few days we could see them, huddled next to their mother, always quiet, always still. Often the mother would perch on a rooftop nearby but away from the nest, trying to fool the ever present cats. Each day the birds grew bigger, until the pair of them began to look like small doves, and not just hatchlings.

We will never know what induced the larger of the babies to leave the nest, but on May 19th only the smaller one was still there. It didn’t take long, unfortunately, to find the larger one. The cats had captured it and mangled it, not bothering to eat it, and left its body down in the front yard by our driveway. We buried it, and hoped the mother had pushed it out so there would be enough food to feed one hatchling to maturity.

After this setback, we kept our two cats inside. Accustomed to being free during the days when we are home, the animals weren’t happy with this fate, but we figured they would only have a few days of confinement before the 2nd baby dove left the nest. We couldn’t control our neighbor’s feral cats, however, two full-time outdoor cats who preferred our property to their own since we don’t have dogs. These two cats, beautiful long haired calico females, were certain to pounce on the one remaining dove if given the chance.

What could we do? But the bird stayed in its nest, and got bigger by the day, until it was more than half the size of its mother. I remember leaving for work on May 23rd, noticing the baby sitting in the nest with its mother. Both of them were motionless, watching me, melded into each other. It is easy to anthropomorphize this mother and child. The devotion of the mother, the dependence of the child. And it was impossible to be unmoved by the sight of them, in their precarious perch above our door, menaced by the cats. The safety of the nest could not last, but they clung together and viewed the world together. What silent understanding did they share in the stillness, during this final, fleeting moment of togetherness?

During these long days of spring the sun sets to the northwest, and for a few lingering hours each evening the rays of the lowering sun shine directly onto our porch, which faces north. I will never forget the sight of this baby dove, nearly ready to leave its nest, on the evening of May 23rd. It sat alone, so motionless, so silent, bathing in its daily moment of sun, sitting in the only world it has known, its small nest, gazing towards the light. What dim awareness, what dawning realization, what rising instinct could it feel? What sense of fate served wordless notice that its time to leave had arrived?

When I left for work on May 24th I looked at this bird for the last time. It was standing in the nest, bigger than ever, motionless as always, watchful, silent. The mother was gone. The day was sunny and bright. It was time.

Later that day my wife called me at work. She had already come home for the day, and the bird was gone. She had looked around for it, and sure enough, its body was left by the driveway, in the same place as the first one. We buried its mangled body next to its sibling. My wife put flowers on the grave.

As an example of trauma, this story is trivial. As an allegory for life, this story is telling. The implacable food chain. Birds eat worms, cats eat birds, coyotes eat cats. At what level in the food chain is there awareness? When is there terror? The worm scarcely knows the bird is picking it apart. Does the bird know fear? Is the bird’s caution merely stimulus and response mechanisms, or is there a glimmer of consciousness? Certainly a cat knows the terror of being hunted, as well as the casual joy of killing. Yet we love our cats, and we love our neighbor’s cats, and see ourselves in their antics.

The fate of this family of mourning doves might symbolize scenarios of our own destiny. What fate will we encounter when we leave the nest of this solar system? Or what if the cat is the symbol of an angry planet, or a collapsed financial system, or a collective madness where the center cannot hold? What if the mourning dove is the symbol of our fragile eras of peace, so easily sundered by the feral and ravenous cats of war? In the eyes of this winged mother and her doomed child we saw the tenderness and terror of the world, and wept.

Why Real Rates of Return Must Fall

Earlier this month the Wall Street Journal published an article entitled “Private Accounts Can Save Social Security,” authored by Martin Feldstein, former chairman of President Reagan’s Council of Economic Advisors and a member of the Wall Street Journal’s board of contributors.

In this article, Feldstein made the following assertion: “With a 3% payroll deduction, someone with $50,000 of real annual earnings during his working years could accumulate enough to fund an annual payout of about $22,000 after age 67, essentially doubling the current Social Security benefit. That assumes a real rate of return of 5.5%, less than the historic average return on a balanced portfolio of stock and bond mutual funds.”

As explored in dozens of posts already, it is pretty easy to paint rosy scenarios when you assume a real rate of return of 5.5%. But “the historic average return” Mr. Feldstein alludes to presumably includes the last 40 years or so, a period during which total credit market debt in the U.S. has doubled five times, and now stands at over 350% of GDP.

In the post “National Debt and Rates of Return,” I tried to get a handle on just what all this debt is doing to our prospects for economic growth and healthy returns on investment. As documented in that article, America’s credit market debt, which includes all consumer, commercial, and government debt, totals over $50 trillion dollars. And the reason this debt has not already crippled the U.S. economy is because the cost of money to most significant debtors is below the rate of inflation. The rate of interest that borrowers pay today – whether they are the U.S. government or people signing 30 year home mortgages – is basically zero.

How then, can a pool of savers as large as America’s entire retired population expect to draw 5.5% on their investments, after inflation, for the next several decades? The reason these returns existed in the past was because we were experiencing debt fueled, unsustainable rates of rapid economic growth. Now that debt levels have reached their ceiling – even with rates at virtually zero, total debt is not increasing any more – growth must slow because less new cash is being loaned to borrowers and injected into the economy. What part of this does Mr. Feldstein fail to understand?

What is particularly irksome, beyond Feldstein’s blithe assertion that a real rate of return of 5.5% is something we can simply take as a given, is that his pronouncement provides cover to the public employee pension fund “experts” who themselves claim a real rate of return of 4.75% is sustainable for decades over decades.

Ultimately, what Feldstein is doing suggests one of two possibilities. Either Feldstein is a tool of the Wall Street cabal that conned an entire nation into drowning themselves in debt, which would mean he is required to maintain the fictional expectation of high returns forever because to change his tune now would be to admit it was all a big con, or he actually thinks the citizens of this nation can continue to pile on debt.

An excellent recent post by Chris Martenson entitled “The Failure of Fed Policy, Why Growth is Dead,” contains information that ought to pour cold water on the notion Americans can continue to grow their debt burden. In his post there is a graphic that shows when, starting in 1970, total credit debt in the U.S. doubled: 1977, 1983, 1989, 1999, and 2007. And since 2007, total credit debt has remained relatively stable, despite the fact that since 2007 the composition of the debt is shifting from the private sector to the government.

For Martin Feldstein, or anyone claiming to speak for a public employee pension fund, or anyone else for that matter, to opine on what real rate of return may be expected on assets totaling trillions of dollars, they must address the fact that total debt in the U.S. is now about 350% of our GDP. For Feldstein to ignore this fundamental variable undermines his credibility, the credibility of the Wall Street Journal, and calls into question any claim they may have to being advocates of financially realistic policies.

If Mr. Feldstein would care to suggest for me an investment portfolio that I could truly rely on to deliver a 5.5% return, after inflation, for the rest of my days, I would sell everything tomorrow to put it there. Rarely has the old disclaimer “past performance is no indicator of future results” been so apt.

The Spice Islands of Interplanetary Space

Back in July 2009, in a post “Industrialize the Solar System,” I laid out the economic “case for space:”

(1)  Space development will catalyze economic development in general, which always enables higher environmental consciousness and greater resources to address environmental challenges.

(2)  Living in space requires recycling technologies for water and air that are many times more demanding than on earth, and these technologies will have applications that will improve water and emission treatment technologies on earth.

(3)  Zero gravity manufacturing and manufacturing off the planet can eventually allow us to do potentially hazardous work in space where there is no danger to the earth’s ecosystem.

(4)  There are benefits in terms of earth observation and ecosystem management that we have only begun to realize through a presence in space.

(5)  We may build satellite solar power stations and beam the energy they produce back to earth.

(6)  We can access minerals on the Moon, Mars, other terrestrial moons, and the asteroids that eventually can take pressure off resources on earth.

To this sixth point, a fascinating comment recently surfaced on a post by Walter Russell Mead entitled “Top Green Admits ‘We are Lost‘,” where the writer quantified the amount of minerals likely to be recoverable in a relatively small (1 km diameter) asteroid. Here is an excerpt:

“A 1 km metallic asteroid (90th percentile iridium richness), mined at a rate of 1 million cubic meters per year, could provide us with the following minerals (as a multiple of our nation’s annual consumption, according to USGS):

Semiconductors –
Gallium: 8x
Germanium: 36x
Selenium: .7x

Precious Metals:
Ruthenium: 8x
Rhodium: 3x
Platinum: 2x
Iridium: 70x

That asteroid, at that specified level of consumption, would last us 500 years.”

Mead’s entire post is worth reading, along with the comments, because he discusses a recent admission by uber-green pundit George Monbiot (here is Monbiot’s original post), who has now admitted there is no shortage of fossil fuel reserves here on earth, nor the likelyhood they will be more expensive to extract than renewable alternatives any time soon.

What is fascinating about space industrialization, however, is it offers a way out of multiple conundrums:

To the extent it is government financed, it represents Keynesian stimulus that not only creates jobs, but preserves and enhances the technological prowess of whatever nation makes this investment.

It yields strategic dividends eventually, in the form of new and relatively inexhaustible sources of critical mineral resources.

It presents an opportunity to build orbiting solar power stations that may eventually deliver cheap and abundant power to cities on earth, which, along with abundant other minerals extracted from the asteroids, will potentially eliminate resource scarcity.

Like the discovery of the spice islands during the previous great era of human exploration and discovery, it creates new outposts for human civilization and vast new sectors for economic growth.

All of this occurs off the earth’s surface, taking pressure off of the relatively finite and environmentally sensitive terrestrial sources of minerals and energy resources.

How Rates of Return Affect Pension Contribution Rates

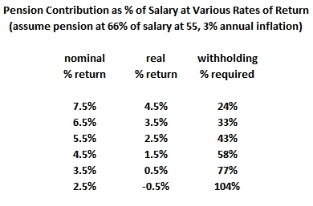
In the post “How Rates of Return Affect Required Pension Assets,” the point is made that depending on the rate of return achievable by the pension fund, there are significant changes to what level of assets are required for that fund to remain solvent. This post takes a slightly different approach; looking at an individual pension participant, how do pension fund rates of return affect how much they will have to contribute into their pension each year?

To make this estimate, the same set of assumptions are used in this post as in the previous post; they are:

  • The participant works for 30 years and they are retired for 30 years.
  • The participant earns a pension equivalent to 66% of their final salary.
  • The participant’s salary, in real (inflation adjusted) dollars, doubles at an even rate between the time they begin working and when they retire.
  • The rate of return and the rate of inflation are held constant throughout the 60 year period under analysis.
  • The rate of inflation is assumed to be 3.0% per year (this is CalPERS official projection, and is consistent with the historical average for the last 90+ years).

Here’s what we get:

There are a lot of takeaways here, but the most important is this:  Even at a return of 7.5% per year, which is actually slightly below CalPERS official long-term projected annual return of 7.75% per year, using these assumptions there is a contribution requirement of 24% of salary per year. This is well above what most cities and state agencies contribute to their employee pension funds each year. But what if pension funds acknowledge they will NOT be earning 7.75% per year any more? What if their earnings merely keep up with inflation?

As shown on the chart, for every 1.0% the real rate of return drops, the annual pension fund contribution as a percent of salary will go up by 10% or more, i.e., if the fund’s real rate of return drops from 3.5% to 2.5%, the amount required to be contributed into the fund as a percent of salary will go from 33% to 43%.

CalPERS spokespersons love to tout the “computer models” and “investment experts” who are confident they can continue to extract a long-term 7.75% return per year. But notwithstanding the fact that these are a lot of the same experts who had computer models that predicted the Dow Jones Average would reach 35,000 by 2005, or that there “might” be a housing bubble,  their confidence ignores several factors:

– The long-term inflation adjusted performance of publicly traded equities in the United States is not quite 3.0% per year, even taking into account dividend reinvestment. The Dow Jones average in 1930 was 286 (ref. Yahoo Finance), and the CPI was 17.1 (ref. Bureau of Labor Statistics). The Dow Jones average at the end of 2010 was 10,856, but the CPI had risen to 216.7. This means the inflation adjusted long-term performance of the Dow Jones average over the past 80 years was a paltry 1.4%. Compare this to CalPERS official long-term, inflation adjusted projection of 4.75% per year.

– Don’t rely on inflation to bail out pensions. The 2.0% annual cap on COLAs automatically lifts when pensioners have lost 20% of their purchasing power – the liability will then remain proportionally intact. This means it remains the fund’s real rate of return, after inflation, that has to be maintained.

– The potential of the U.S. economy to grow over the past 60 years, fueling these higher-than-sustainable historical returns for CalPERS and other pension funds was for two reasons that will not apply today: (1) the U.S. economy 60 years ago was the world’s only intact post-WWII economy, and grew at an extraordinary rate as we exported manufactured goods to the recovering economies elsewhere in the world. Today our manufacturers face formidable competition from developed and emerging economies all over the planet, (2) as the U.S. began to encounter global competition over the more recent decades, the U.S. embarked on a debt binge that is coming to an end.

– In past decades pension funds represented a smaller slice of the economy, meaning that they could beat the market without causing distortions. Today pension funds are the single biggest source of new investment in the U.S. They can no longer expect to beat the market. They are too big.

– A related challenge is the fact that pension funds are now servicing a growing number of retirees. The ratio of retirees to workers is approaching 1-to-1, meaning that fund withdrawals to make pension payments is reducing demand for equities because the pension funds are doing more selling than ever before. This, too, puts downward pressure on equities.

– The recent rise in equity values has to be viewed in the context of the above factors, which means what goes up may be coming down, but also in the context of the strength of the dollar. As the dollar devalues, the real value of U.S. equities shrinks apace. But if the underlying viability of these companies has not changed, their dollar denominated equity value has to adjust upwards in order for their value to stay neutral when compared to foreign currencies. And if the dollar strengthens (since all nations are competing to devalue their currencies these days), the value of U.S. equities – all else being equal – will fall again. And, to complete the thought, if the dollar doesn’t eventually rebound against foreign currencies, domestic inflation will offset any gains in equity values driven by dollar devaluation.

A serious discussion about what rate of return gigantic pension funds can really earn in America in this era, as opposed to previous eras, has not yet taken place. The performances of massive government worker pension funds hold dire implications for taxpayers who are on the hook to cover the difference whenever expectations do not meet reality. For these reasons, it would behoove CalPERS and other pension funds to trot their economists into the limelight to defend their assumptions, instead of hiding behind soundbites uttered by public relations specialists with well-modulated voices.

Require CalPERS to Invest 100% in California?

According to the CalPERS website, in their California Investments section, “as of January 31, 2011, approximately 10.3 percent of CalPERS total assets are invested in California.” This means that out of the $233.5 billion in assets under management by CalPERS (ref. Current Investment Fund Values), $24 billion is invested in California.

Apparently CalPERS would have us believe that investing 10.3% of their assets in California is a praiseworthy accomplishment, since their disclosure goes on to state “CalPERS is one of the largest investors in California – providing jobs, services, and a financial boost to the State’s economy.” But why shouldn’t CalPERS invest 100% of their funds in California?

Back in 2004 I attended a business forum focusing on the Sacramento region, and listened to a panel of experts discussing California’s economic prospects. One of these experts was an investment manager from CalPERS, who stated with pride that “fully 20% of CalPERS investments are made in California.” (Note: it’s only half that much today) At the time, I asked him why we should be impressed by the fact that 100% of CalPERS funds come from California taxpayers, yet only 20% of those funds go back into California-based investments. His answer was instructive: “We have to invest where we can realize the largest returns.”

The debate over whether or not public employee pension funds are sustainable hinges on one key question: What are the largest sustainable, long-term returns possible? And from that standpoint it is completely rational for CalPERS, and CalSTRS, and the dozens of smaller California-based public employee pension funds to invest their money elsewhere: China, India, Brazil, Texas, Wyoming, wherever. But since public employee pension funds are operated for the benefit of public employees, who, through their unions, virtually control California and are largely responsible for the regulatory environment that has made places like Brazil and Wyoming far more lucrative places to invest, it would be fitting to require 100% of pension fund investments for California’s employees to be invested in California.

This one reform – requiring CalPERS to invest 100% of their funds in California – would have several salutary benefits. First of all, it would force an honest discussion as to what rates of return are truly achievable and sustainable. And, obviously, it would be a tremendous boon to California’s economy. After all, if investing 10.3% of CalPERS funds has provided “jobs, services, and a financial boost to the State’s economy,” imagine what benefit might accrue if ten times as much money was invested in California?

Libertarians and free-market advocates may correctly criticize this proposal as being counter to their principles of open markets and free trade, but these principles might be better applied to private money – CalPERS and the other public sector pension funds are using taxpayer’s money. And by forcing these funds to invest exclusively within the markets where these taxpayer’s live, these taxpayers will at least enjoy the economic stimulus created by these investments, even if they can’t enjoy these generous pensions themselves.

Even more important, by forcing California’s public sector pension funds to invest exclusively in California, an honest conversation will be started at last regarding how California’s business climate has been ruthlessly suppressed. It is more than ironic that the public sector unions – who are largely responsible for California’s hostile regulatory environment – allow their pension funds to turn to Wall Street’s globalized investment apparatus to realize rates of return that they themselves have made impossible to achieve in California.

If public employees and their unions knew that the rates of return their pension funds will earn are going to be based on how healthy the business climate is right here in California, they would be far more likely to advocate a rational recalibration of California’s taxes and regulations. They would also be more likely to accept that an inflation adjusted rate of return of 4.75% (CalPERS official rate) is probably too high, and accept reasonable cuts to their current and future pension benefits accordingly.

How Rates of Return Affect Required Pension Assets

While pension finance is a relatively obscure discipline that requires of its practitioners expertise both in investments and actuarial calculations, it is a mistake to think the fundamentals are beyond the average policymaker or journalist. One policy question of extreme importance to discussions about the future of public worker pensions is how much pension funds can legitimately expect to earn over the long term. The reason this question is critical is because the more the pension fund earns, the lower the annual contribution will have to be. Just how much lower each percentage point gain offers is startling.

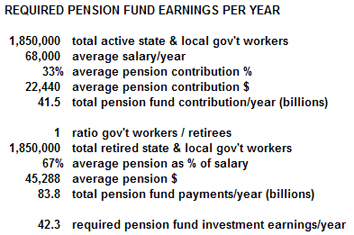
In the first table (below), conservative assumptions are offered towards estimating how much the pension funds of California’s state and local workers must earn each year. The number of active state and local government workers is fairly well documented at 1.85 million (including K-12 and higher education). The $68,000 per year annual salary is actually low, since that is the average salary, and pension fund calculations are based on the higher final salary. This means the $68,000 figure is accurate for estimating the money flowing into the pension system, but will understate the amount of money flowing out of the pension system to retirees. Similarly, the 33% average pension fund contribution is on the high side – typically only public safety employees, who are only about 15% of the state and local government workforce, contribute amounts over 30% of their salary into the pension funds. But based on these numbers, each year California’s state and local workers pour $41.5 billion into the state and local government worker pension funds.

The second half of the table (above) estimates how much money comes out of the state and local government pension funds each year. This projection shows a ratio of retirees to active workers of 1-to-1, based on the assumption that – using full-career-equivalent workers and retirees – the average worker is employed for 30 years, and is then retired for 30 years. This is an important concept to linger on, because the concept of “full-career-equivalent” is crucial to understanding why CalPERS spokepeople are accurately able to claim the “average” pension is only $25,000. In reality, that is only true when considering all employees who ever passed through the CalPERS system – even if they only worked for five years and barely vested a pension.

This concept also applies when calculating the “average pension as percent of salary,” where based on existing pension formulas, 67% is on the low side when dealing with full-career-equivalent numbers. Typical government pensions in California accrue between 2.0% and 3.0% per year – teachers, who are 40% of the public workforce, who work 30 years receive 2.5% per year, public safety workers, who are 15% of the workforce, receive 3.0% per year. It is common for public utility workers to receive 2.7% per year. So estimating an average pension of $45K per year, based on 67% of $68K, is almost certainly on the low side. This means California is projected to pay out $83 billion per year to their retired state and local workers. In reality, current formulas and data suggest they will pay out a lot more than that.

The point of the first chart is that the money going into the government worker pension funds in California is estimated to be $41.5 billion per year, and the amount of money being paid out of these pension funds to retired state and local government workers is projected to be $83.8 billion per year. This means $42.3 billion per year will have to be earned on the market through investment returns.

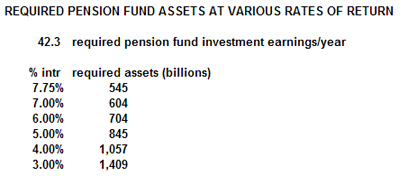
The second chart (below) shows what the necessary asset balance is based on various rates of return. The calculation is extremely straightforward – take the amount that has to be earned each year, and divide that amount by the rate of return the fund is going to deliver:

As can be seen, at a rate of return of 7.75%, which is CalPERS (and most other government worker pension funds) official long-term projected rate of return, “only” $545 billion in assets are necessary for these funds to be “fully funded.” But if this rate of return is dropped by a few percentage points, the necessary assets mushroom. What if pension funds were required to stop making risky investments and instead had to buy treasury bills? Don’t be surprised if that is necessary someday – for example when nobody else will buy T-bills… What an elegant solution to the challenges posed by quantitative easing. But California’s pension funds would go from being fully funded at $545 billion to being only 39% funded – and the necessary asset balance would increase by $864 billion to $1.4 trillion.

The reason we don’t hear more about the serious discussions over what the real long-term rate of return should be for these massive funds is because they are occurring behind closed doors, and the reason for that should be clear by studying the above table. How on earth would Californian taxpayers cough up $864 billion? How and when will the actuaries and investment experts deliver this shock to the system?

Because current pension benefits have a cost-of-living-adjustment cap of 2% that is lifted as soon as the purchasing power of the pension benefit erodes to between 75% and 80% of the original award, don’t expect inflation to bail out the government worker pension system. Even more alarming than the nominal projection of 7.75% used by CalPERS is their real rate of return – they assume 3.0% inflation and expect an inflation-adjusted return of 4.75%. That may have been possible in the days when asset bubbles were inflating which collateralized what is now $50 trillion in debt (commercial, household and government combined) in the U.S., but those days are done.

Even if pension funds – that in aggregate in the U.S. currently manage about $3.0 trillion in assets – could earn a 4.75% (long-term, after inflation) return, they would do so by beating the market. This means other market participants, i.e., individual small investors with their 401Ks, would lose. This predatory relationship between large public sector pension funds and the small investors is ignored by apologists for public sector pension funds, who both claim “Wall Street” is to blame for the 2007 market crash, yet rely on Wall Street to deliver for them, decade after decade, higher than market rates of return.

Finally, if taxpayers are to fund market investments for the purposes of augmenting the retirement assets available to workers in the United States, it should be for ALL workers, not just government workers. As it is, however, the existence of gigantic, aggressively managed funds whose entire risk is borne by taxpayers creates a dangerous distortion in the investment market. It is ridiculous that in an era of unavoidable debt reduction, when the federal composite borrowing rate is less than 1% per year, taxpayer supported Wall Street entities – i.e., government worker pension funds – are claiming they can earn 7.75% per year. The longer they cling to this fiction, elevating their portfolio risk to achieve the unachievable, the more volatile the entire market will become.

Policymakers have to face the fact that when these projected rates of return come down, and they will, government worker pensions as they are currently formulated will disappear. Hiding behind the “complexity” of this issue, and instead echoing the sanguine talking points of CalPERS spokespersons who have not sat in the closed door meetings, is simply irresponsible.

Which Special Interests Are Partisan?

A commenter to the previous post, “Is Union Reform Partisan,” took issue with the observation therein that corporate political spending is less partisan than union political spending. The commenter requested evidence to back up that claim, and suggested that not only is corporate spending equally skewed in favor of Republicans, but that corporate political spending far outweighs political spending by unions. These are fair questions, and the data that follows draws from the same source used in that post, which documented that 95% of union spending goes to Democrats.

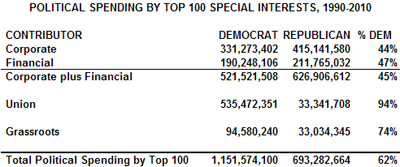
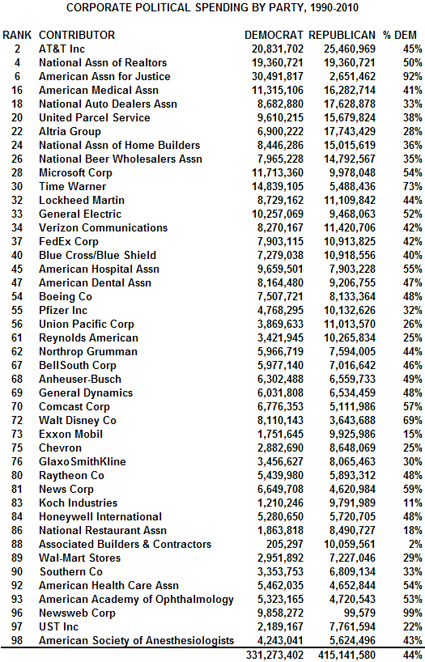
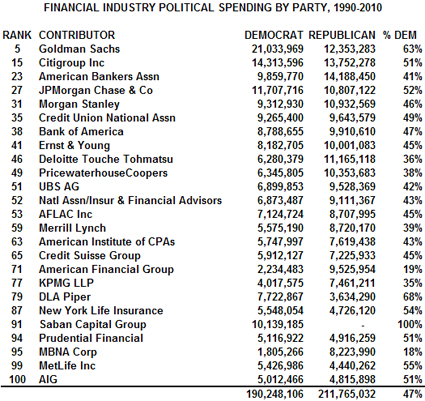
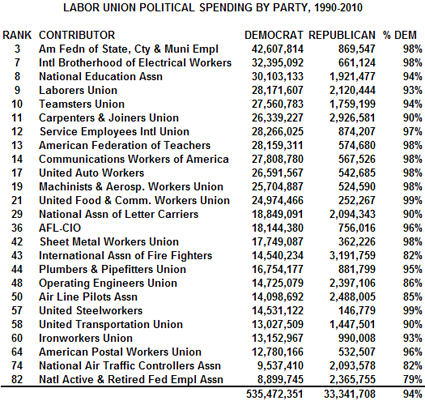
Parsing data from OpenSecrets.org, again, “a nonpartisan, independent and nonprofit research group tracking money in U.S. politics,” this time I will present information on all of the top 100 political spenders during the eleven election cycles between 1990 through 2010. These top 100 are divided into four categories; corporate, financial, union, and grassroots. The results were quite surprising, as summarized on the chart below:

The data used to generate these numbers comes from OpenSecrets.org’s “Top All-Time Donors, 1990-2010” table, which I downloaded onto spreadsheets and sorted into the four categories noted, while retaining in the far left column the rank of each contributor within the top 100. So the reader may view my assumptions, all four of these tables constitute the remainder of this post.

Readers are invited to mull the implications of these findings regarding the top 100 political spenders of the last 20 years in America:

1 – The corporate and financial sectors combined did outspend unions, by a ratio of almost exactly 2-to-1.

2 – Unions spent 95% of their contributions on Democrats.

3 – The corporate sector spent 56% of their contributions on Republicans, and the financial sector spent 53% of their contributions on Republicans. Their spending between the two parties was essentially nonpartisan.

4 – Overall, among the top 100 political spenders of the last 20 years, Democrats collected 62% of the takings, and Republicans only collected 38%.

It remains open to interpretation which party might be more beholden to special interests…

Here is the data:

*  *  *

*  *  *

*  *  *

Is Union Reform Partisan?

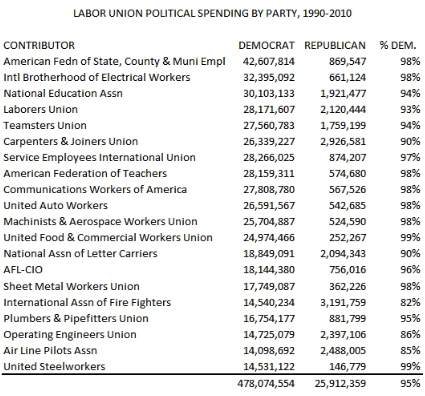
Advocates of public sector union reform have long been accused of playing partisan politics, but the data suggests it is the unions, not the reformers, who are political partisans. According to OpenSecrets.org, a nonpartisan, independent and nonprofit research group tracking money in U.S. politics, just the top 20 labor unions over the past 20 years have spent over $500 million on federal election campaigns, and 95% of that spending went to Democrats.

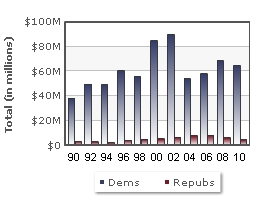
This data is compiled by OpenSecrets.org on their webpage “Labor: Long-Term Contribution Trends.” On the chart below the blue bars represent labor union contributions to Democrats, and the red bars represent labor union contributions to Republicans. They show the total reported political contributions for the last eleven two-year election cycles through 2010.  The red bars are scarcely visible.

The next table, which extracts data from the OpenSecrets webpage “Heavy Hitters: Top All Time Donors” (below) shows the top 20 labor union’s political contributions to each party for the same 22 year period. Among most of the major labor unions, the contributions are nearly 100% to Democrats. Overall, 95% of political contributions by labor unions have gone to Democrats, and only 5% to Republicans.


One can argue as to whether or not the agenda and policies of Democrats and Republicans are the cause or the effect of political contributions. But there can be no doubt that the overwhelming preference of organized labor is to contribute to Democrats. Their agenda, as reflected in their political giving, is explicitly partisan.

Because unions are, presumably, grassroots organizations supported by their members, the extent to which unions practice partisan politics becomes a regulatory issue. After all, unless literally 95% of union memberships are comprised of registered Democrats, how can unions, who purport to represent their members, justify allocating 95% of their political spending to Democrats? Could it be because unions are not grassroots organizations, but instead are special interests who have managed to carve out a unique niche in American politics? Should unions have the right to demand an employer fire any employee who doesn’t want to join their ranks? In 28 states, that is the law. Should unions be able to use membership dues in any manner they wish, even if they contribute the money to politicians and causes that are not representative of their memberships?

With public sector unions, the unique ability of unions to compel membership and compel political contributions is compounded because their partisanship violates the principle that government organizations should be politically neutral. Is it appropriate for government workers who police us, protect us, regulate us, rescue us, care for us, and teach our children, to also tell us how to vote? Is it appropriate for public sector unions to spend overwhelming amounts of money on political campaigns to elect the people who they will then negotiate with for pay and benefits? Should public sector unions even be allowed to exist, much less involve themselves in politics, if the government entity they bargain with can simply raise taxes to cover the costs of their negotiated increases to pay, benefits, and headcount? Because in the private sector, at least union negotiators know that if their demands become too costly, the company will go out of business.

It is not partisan to ask these questions when the unions, especially public sector unions, engage in partisan politics. They do this often in defiance of their members own political preferences. In the case of public sector unions, their partisan politics violates the ideal of a politically neutral government workforce, and is not subject to the discipline of the market. It is not partisan to explore reforms that may address these issues.